Observability & Telemetry Standards
Purpose & Scope
This paper defines the architecture principles, minimum capabilities, and expected outcomes for observability and telemetry. It is intended to be extended with engineering-led standards, reference patterns, and implementation guidance for approved tools, frameworks, and platforms.
This document intentionally does not cover:
-
Selection of a single mandated implementation stack is out of scope for this version of the document.
-
Design of events, signals, alerts, and KPIs required for specific use cases.
-
Prioritization and resourcing (when to add observability to existing systems; and the operating model for adoption and maintenance—when, how, and by whom).
-
Detailed telemetry standards, enterprise-wide schemas, or semantic conventions beyond the minimum requirements in this document.
Terminology
| Term | Description |
|---|---|
Log |
A time-ordered record of activities emitted by a component. |
Metric |
A measure of something; a derived quantitative measurement or approximation for otherwise qualitative phenomena. |
Signal |
A category of telemetry used to observe system behavior. In this document, logs, metrics, traces, and events are treated as complementary observability signals. |
Event |
A named occurrence at a point in time that is meaningful for operational understanding, auditing, or action. Examples include deployments, configuration changes, state transitions, and notable business or system outcomes. |
Trace |
End-to-end representation of a request, transaction, or work unit across components and dependencies, used to attribute latency, failures, and execution flow. |
Alert |
A notification to an observer that an event occurred, on which the observer needs to take action. |
KPI |
A key performance metric used to help an organization define and measure progress toward its goal (e.g., SLO). |
Observability |
The ability to understand, diagnose, and act on system behavior using correlated telemetry and contextual information, including investigation of previously unknown issues. |
Product |
A user-facing offering managed as a lifecycle (roadmap, ownership, support). A product typically includes multiple components. |
Component |
A deployable unit that provides a defined capability via an interface (API, event stream, job contract), with clear ownership, ideally following a single-responsibility pattern. |
SLO |
The service level objective is a target for reliability or performance of a service (e.g., 99% of requests < 200ms). |
System |
A collection of interacting components (data stores, queues, clients, infrastructure) delivering outcomes. |
Telemetry |
Data emitted or derived from systems to support observation, correlation, analysis, and action. In this document, telemetry includes logs, metrics, traces, and events together with the context needed to interpret and relate them. |
Vision
Every system and component we deliver must be observable by design. Observability is a product capability that enables teams to detect degradation early, understand impact quickly, identify contributing changes and dependencies, and take effective action before users are materially affected. Telemetry should produce measurable, actionable insight that supports evidence-based decisions, continuous improvement, and portfolio-level governance.
Objectives
-
Establish observability, telemetry, and actionability as a CS CoE standard through shared principles.
-
Support portfolio-level governance with comparable health and change indicators.
-
Enable data-driven product evolution via automated insights.
-
Unify telemetry into correlated end-to-end visibility across systems.
-
Identify degradation early to prevent user impact.
Reference model
The figure below is a tool-agnostic logical reference model for observability and telemetry. It does not prescribe a specific product topology, vendor architecture, or deployment pattern. Instead, it shows the logical capabilities that an observable system must support: telemetry production, common context and correlation, collection and processing, storage and query, insight generation, and operational action. These capabilities may be implemented by one platform or by multiple integrated components.
The purpose of the model is to show how telemetry flows from systems into an observability capability that supports investigation, service-level understanding, alerting, and response.
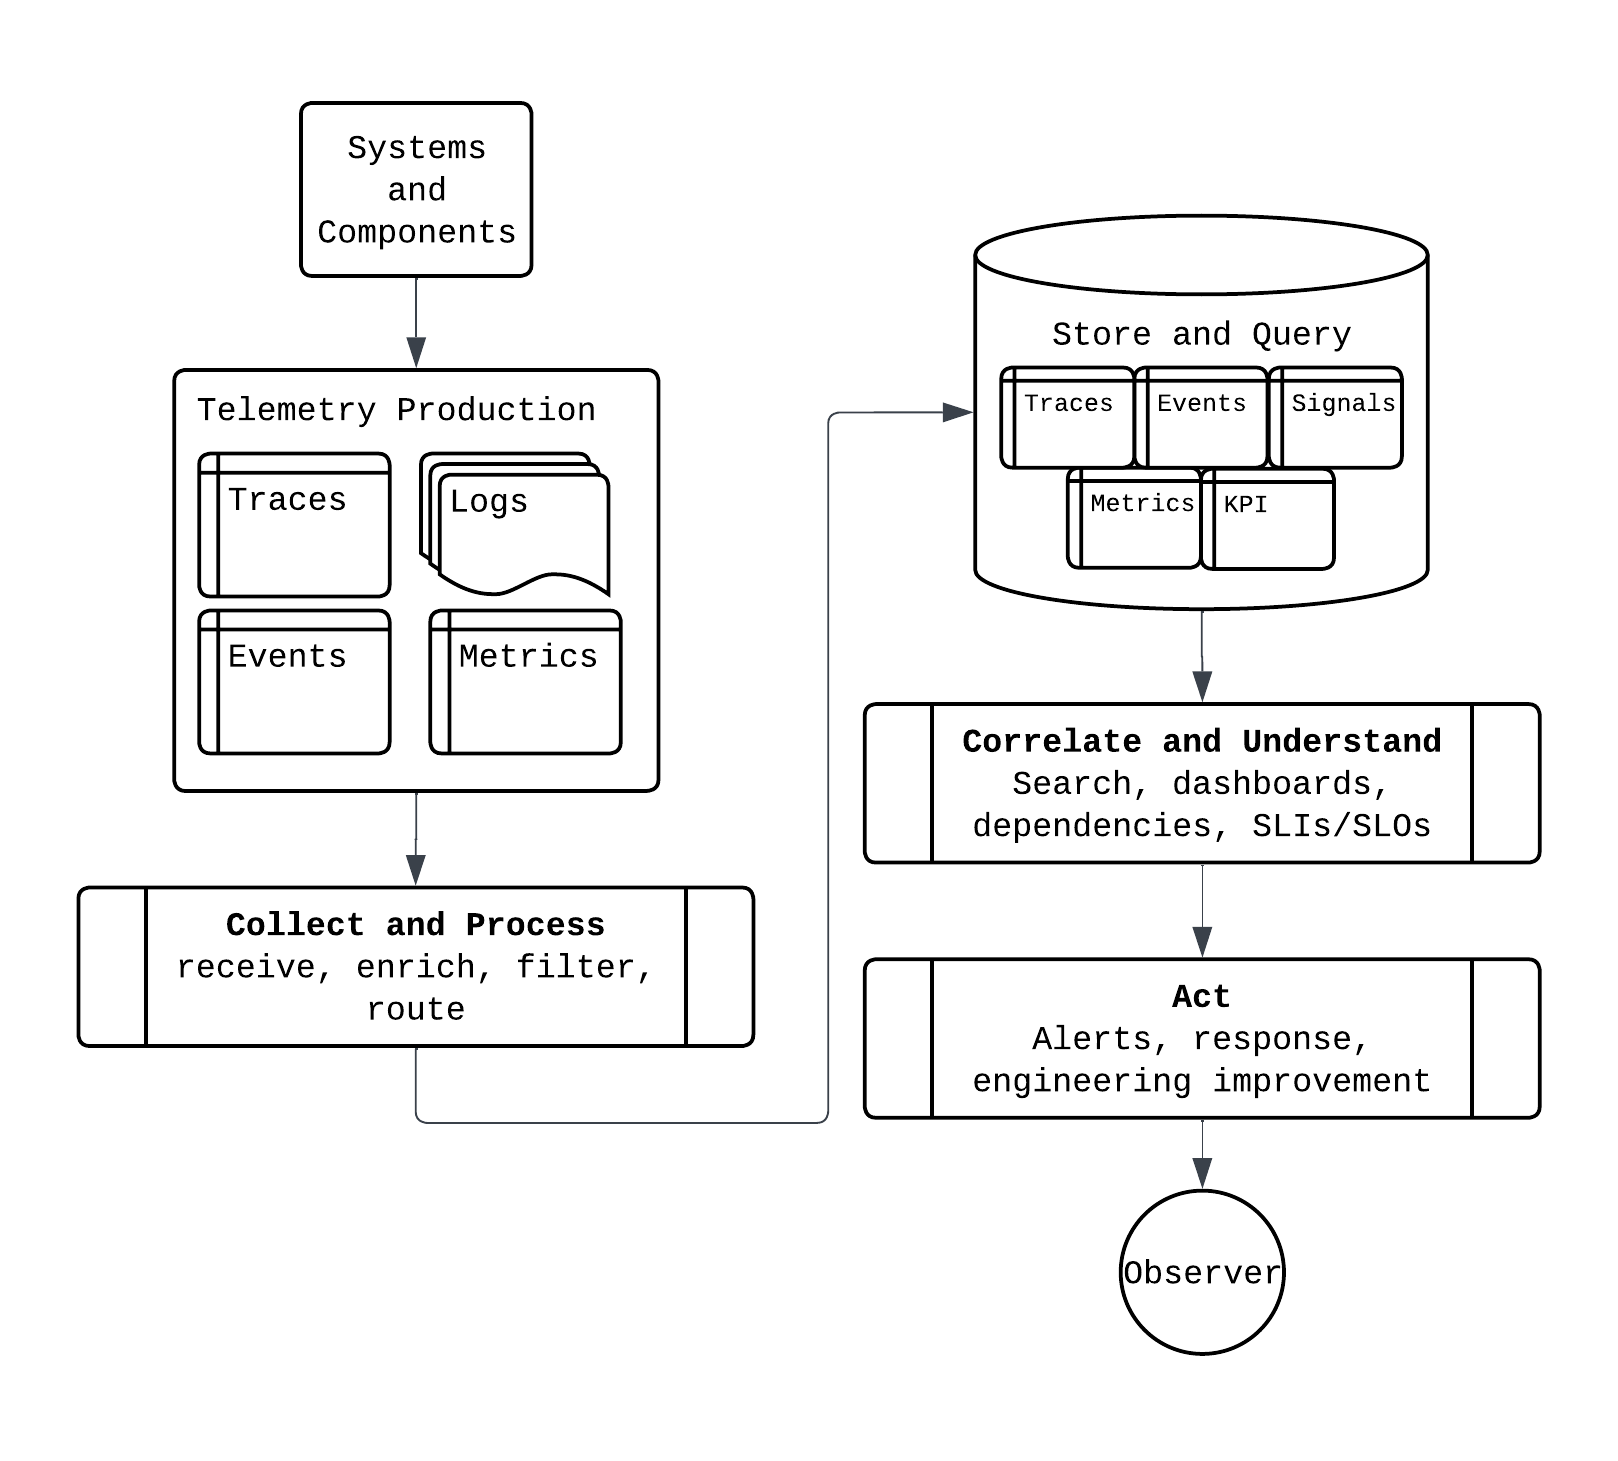
Figure 1. Logical observability and telemetry reference model. The figure shows the logical capabilities required to produce, collect, store, correlate, and act on telemetry. Boxes represent architectural concerns, not mandated products or deployment units.
Architecture standard
This document defines the outcome-based architecture standard for observability and telemetry in CS CoE. It is tool-agnostic and establishes the minimum capabilities, telemetry expectations, and operational outcomes required for production systems. The standard is intended to evolve with engineering input into more specific implementation guidance, semantic conventions, and reference patterns.
Minimum observability requirements
A system is architecturally observable when teams can answer:
-
Is it working? (availability, latency, where relevant)
-
For whom is it not working? (environment, region/zone)
-
Where is the failure or bottleneck? (component, dependency, step)
-
What changed? (version, config, deployment, feature toggle, dependencies)
-
What is the next action? (actionable alert, clear owner, next steps)
These outcomes should be achievable using correlated telemetry rather than manual reconstruction from isolated data sources.
Minimum expectation
Every production component MUST provide:
-
Identity and context across telemetry. Telemetry emitted by a component must include enough context to identify the source and support correlation. Examples include component or service name, version, environment, region or zone, operation name, dependency name, and correlation context, where applicable.
-
Actionable telemetry aligned to user impact. The component must expose logs, metrics, traces, and/or events as appropriate to determine whether critical user-facing or business-critical operations are succeeding, failing, or degrading.
-
Dependency visibility with attribution. Failures, latency, retries, timeouts, and degradation must be attributable to key dependencies such as databases, queues, identity providers, or external APIs, so teams can distinguish internal faults from dependency-induced issues.
-
Service-level monitoring for critical journeys. Where the component supports a critical workflow, teams must define how success, latency, reliability, and relevant quality measures are evaluated and monitored for that journey.
-
Ownership. A clearly identified team must own the observability assets for the component, including dashboards, alerts, response guidance, and, where applicable, SLI/SLO definitions and review.
Note: Avoid emitting telemetry that does not support investigation, decision-making, or action.
Telemetry guidance
Common context, correlation, and conventions
Telemetry from production systems MUST carry enough shared context to identify the producing component, correlate activity across boundaries, and support operational investigation.
MUST
-
Use consistent identifiers for component or service, version, environment, and owner.
-
Carry enough context to relate telemetry to the relevant operation, dependency, or workflow step.
-
Support correlation across boundaries where feasible, including synchronous calls, asynchronous flows, and scheduled or batch execution.
SHOULD
-
Use a shared taxonomy for names, attributes, dimensions, and reason categories.
-
Apply consistent conventions across logs, metrics, traces, and events so they can be interpreted together.
-
Record change context where relevant, such as deployment version, configuration version, or feature state.
MUST NOT
-
Rely on free-text-only conventions when structured context is operationally required.
-
Use inconsistent identifiers for the same component, dependency, or operation across telemetry types.
Logs (log records that record what happened)
MUST
-
Be timestamped to at least 1 second (or more frequently if needed)
-
Be tagged with structured information that provides the context of the log message
-
Be stored and accessible in a way that allows authorized teams to efficiently query, filter, and correlate logs for operational investigation and incident response.
-
Support investigation by recording meaningful events with severity, context, and correlation information where available
SHOULD
-
Use event-style logging that records what happened, where, and with what outcome.
-
Better: “User authentication failed: reason=token_expired, component=auth-service.”
-
Less useful: “Something went wrong in the auth flow.”
-
-
Use stable error codes or reason categories that support aggregation and trend analysis across repeated failures.
-
Better:
AUTH_TOKEN_EXPIRED,VALIDATION_FAILED,DEPENDENCY_TIMEOUT -
Less useful: changing free-text messages such as “token bad”, “JWT issue”, “auth problem”, or raw exception text only
-
MUST NOT
-
Contain security data such as passwords, tokens, and keys
-
Contain sensitive personal data
-
Contain confidential (C3) or highly confidential data (C4)
-
Log full payloads by default
Metrics (measurements captured at runtime)
MUST
-
Enable success, failure, latency, and throughput measurement for critical operations where relevant.
-
Be timestamped at a resolution appropriate to the use case.
-
Carry structured dimensions that provide the context needed for aggregation and operational interpretation.
SHOULD
-
Separate symptom metrics (user impact) from cause metrics (resource saturation, dependency health, or internal contention).
-
Aggregate meaningfully by operation, component, dependency, environment, version, and region where relevant.
-
Use a well-defined taxonomy for metric names, units, and dimensions.
-
At a minimum, metric dimensions SHOULD include, where applicable: Solution or product name, Component or service name, Environment, Operation, Dependency, Version.
MUST NOT
-
Use high-cardinality values such as user IDs, record IDs, raw URLs, or free-text values as metric dimensions.
Events (named occurrences at a point in time)
MUST
-
Be descriptive of the occurrence such that an operational or business action can be taken if needed.
-
Record the time the event occurred.
-
Carry a structured context that identifies the relevant component, workflow, or change.
SHOULD
-
Record operationally relevant change events such as deployments, releases, configuration changes, feature-state changes, and major lifecycle transitions.
-
Link events to the same identity and correlation context used by other telemetry, where feasible.
-
Link events to related telemetry or service-level measures when doing so improves understanding.
MUST NOT
-
Contain security data such as passwords, tokens, or keys.
-
Contain sensitive personal data.
-
Contain confidential (C3) or highly confidential data (C4).
Traces (end-to-end causality across operations)
MUST
-
Support end-to-end correlation across components and dependency boundaries.
-
Enable attribution of latency and failures to a component or dependency.
SHOULD
-
Make the key workflow traceable at a level that supports diagnosis.
MUST NOT
-
Include secrets or sensitive data in trace attributes.
Operational guidance
SLIs / SLOs / KPIs
SLIs, SLOs, and KPIs are derived operational or business measures built from telemetry and related operational data. They are used to express whether critical services and journeys are meeting expected reliability, performance, and outcome targets.
MUST
-
Measure success for critical operations, services, or user journeys.
-
Have a clearly defined scope, calculation method, and owner.
-
Be understandable enough to support governance, prioritization, and improvement decisions.
SHOULD
-
Distinguish user-impacting measures from internal diagnostic measures.
-
Be reviewable over a defined reporting period.
-
Express service health, reliability, and outcome quality in forms that support prioritization and continuous improvement.
-
Use consistent naming and categorization across related services or products.
MUST NOT
-
Be defined so ambiguously that different teams could calculate or interpret them differently.
-
Depend on high-cardinality identifiers or unstable free-text values for their core definition.
Alerts and response
MUST
-
Describe the condition or impact that triggered the alert.
-
Identify a clear owner or responding team.
-
Provide a recommended next action or link to response guidance where available.
-
Carry enough context to support triage, including affected component, environment, and relevant dependency or workflow.
SHOULD
-
Indicate severity or impact level.
-
Link to related telemetry, service-level measures, dashboards, events, or traces where relevant.
-
Minimize avoidable noise through sensible thresholds, grouping, suppression, or deduplication.
MUST NOT
-
Contain security data such as passwords, tokens, or keys.
-
Contain sensitive personal data.
-
Contain confidential (C3) or highly confidential data (C4).
-
Be triggered on conditions that do not support a clear operational decision or action.
Recommended best practices by capability
These capability patterns describe the minimum observable outcomes expected from common architectural styles. They are intentionally technology-neutral and do not prescribe a specific implementation mechanism.
CRUD APIs and synchronous request/response
Goal: Make business operations diagnosable: “Is it working, for whom, and why not?”
MUST
-
Measure success/failure by operation and outcome class.
-
Measure latency distribution for critical operations.
-
Make failures attributable to the relevant operation and dependency path.
SHOULD
-
Ensure error classification supports triage without manual log searching.
MUST NOT
-
Treating all errors as equal (“500 everywhere”).
-
Missing correlation between incidents and operations.
Persistence and data access
Goal: Attribute latency, errors, and saturation to persistence layers and distinguish them from application logic.
MUST
-
Observe latency and failures for persistence operations.
-
Make timeouts and retries visible.
-
Observe saturation or contention indicators where relevant (for example, connection pool exhaustion, queue depth, lock contention, throttling).
SHOULD
-
Separate read and write paths, and distinguish high-impact or latency-sensitive persistence operations where relevant.
MUST NOT
-
Emit sensitive data from persistence layers.
Authentication and authorization
Goal: Observe AuthN/AuthZ outcomes and dependency impact without exposing sensitive data.
MUST
-
Observe AuthN outcomes with reason categories (expired, invalid, denied, upstream unavailable).
-
Observe latency/error contribution from identity and policy dependencies.
-
Make abnormal authentication failure patterns visible for operational and security investigation.
SHOULD
-
Separate AuthN (identity validation) from AuthZ (policy decision) outcomes.
-
Keep security-relevant failures visible without sensitive claims.
MUST NOT
-
Emitting secrets, tokens, or sensitive claim contents.
-
Collapsing all auth failures into a single bucket.
External integrations
Goal: Separate internal failures from dependency failures and quantify dependency impact.
MUST
-
Observe per-dependency success rate, latency, degradation, and error classes.
-
Make retries, timeouts, and fallback behavior visible.
SHOULD
-
Maintain per-dependency operational views.
MUST NOT
-
Leave user-facing failures unattributable to a specific dependency.
Batch jobs, scheduled tasks, and pipelines
Goal: Make batch execution diagnosable end-to-end per run.
MUST
-
Observe run status (started/completed/failed) and duration.
-
Observe throughput and outcomes (success/failure categories).
-
Observe stage-level bottlenecks (where applicable).
-
Observe expected vs actual execution, including missed, delayed, or incomplete runs where relevant.
SHOULD
-
Provide run-level correlation for investigation and change attribution.
MUST NOT
-
“Only failures are logged” (no baseline).
-
No way to connect issues to a specific run or version.
Frontend experience
Goal: Measure user impact and connect client failures to backend capabilities.
MUST
-
Measure whether critical frontend flows reach their intended user outcome, including completion, failure, or abandonment where applicable.
-
Measure perceived latency and client-side failures for critical journeys.
-
Correlate frontend failures to backend capabilities or dependencies where feasible.
SHOULD
-
Capture frontend navigation and usage context where operationally useful, such as entry point, pages or features used, and step progression through critical flows.
-
Segment frontend experience by environment, client type, or release version where operationally useful.
Event-driven and asynchronous messaging
Goal: Make message-driven processing diagnosable across producers, brokers, and consumers.
MUST
-
Observe message production, delivery, consumption, retries, and failures.
-
Make correlation possible across producer, broker, and consumer boundaries where feasible.
-
Observe backlog, lag, dead-letter outcomes, and processing latency where relevant.
SHOULD
-
Segment user-impact measures by environment, client type, release version, or user cohort where operationally useful.
MUST NOT
-
Lose attribution between a failed outcome and the message, topic, queue, or consumer path involved.